ARC-PA 5th Edition Standards: Presenting Data for Appendix 14D and 14E

Thank you for returning to our series on meeting the ARC-PA 5th Edition Standards in your SSR. We are now ready to respond to the requirements of the ARC-PA’s 5th Edition Standards, Appendices 14D and 14E.
Appendix 14D requests that you provide data on your student evaluations of their clinical rotations and preceptors, the number of final clinical rotation grades of C or below, and an analysis of Student attrition and remediation in clinical rotations.
Appendix 14E requires the presentation of data relating to summative evaluation performance, exiting student/graduate feedback, and faculty evaluation of the curriculum to assess its ability to prepare students to achieve program defined competencies. However, the matter of analyzing competencies is complex enough that I will address it in a separate blog.
For today, let’s look at how you can efficiently present evaluation data for both appendices.
Presenting Evaluations
When presenting a summary of the student evaluations, be certain to include the following:
- Rotations must be listed by type (medical discipline)
- Data must be included for all clinical rotations
- Preceptor data must be aggregated by medical specialty/ discipline
- If reported, individual preceptors must not be identified by name but must be identified with an anonymous identifier
- Quantitative data must be reported in aggregate and displayed in tables or graphs that directly support the analysis
- Qualitative data themes used in the analysis must be reported and summarized in the narrative or displayed in an appended document
- Data must be presented in a way that allows comparison among rotation evaluations and allows appreciation of trends over time
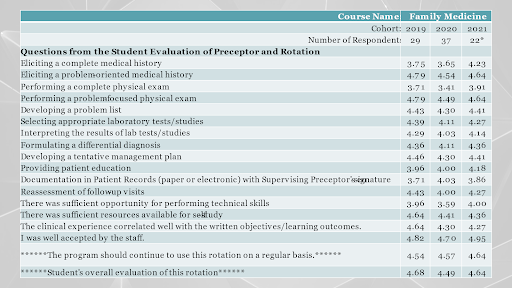
This chart evaluates each individual questions for responses across the years:

The following chart includes the students’ evaluation of a rotation, and their preceptor’s ability to educate them:
Appendix 14E requires the tabular or graphic display of your summative evaluation performance for the three most recent graduating classes. The data is to be used to support the narrative on analysis of the program’s ability to prepare graduates to achieve its defined competencies.
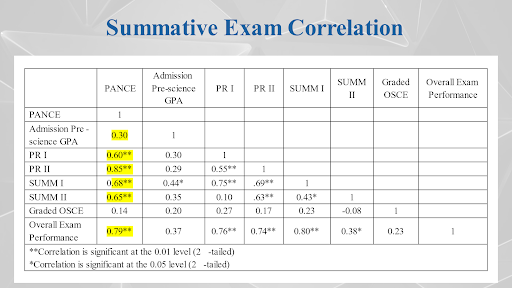
One way to look at this, is to see how strong the correlation is between different elements, such as in the Summative Exam Correlation chart:
I like to do a multivariate analysis here. In other words, I do an analysis of all admissions, academics, clinical and summative variables against the PANCE. Not only with correlation, but also with regression. I do have a statistician as a colleague that is part of Massey Martin’s business that is part of this process. Those of you who are familiar with correlations will note that the ones that are yellow are considered significant at the .01 level. This also looks at the overall exam performance.
Appendix 14E also addresses exiting student/graduate feedback.
Here I’d make a couple of suggestions about your Exiting Student Survey. Look at a student perception of learning, of the atmosphere of the school. I try to connect the exiting survey as much as possible with the program’s overarching competency or program learning outcomes. But that’s just one way of doing that.
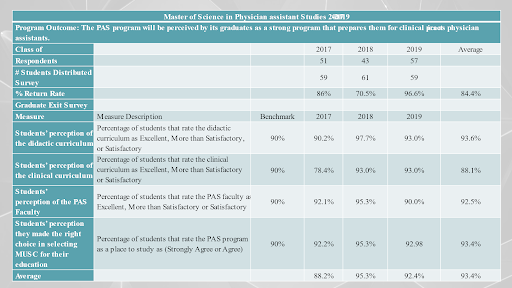
This is a typical chart where we have, in this case, four years of data with overall averages. What you’re looking for is downward trends – anything that suggests something is declining.

This final chart looks at overall program perceptions. A program defines its own benchmarks. If it’s clear; as long as you decide how you are measuring these elements, it is your prerogative to define them.
Conclusion
Appendices 14D and 14E request quite a bit of data for presentation. If you would like to learn more about responding in your SSR, remember that Massey Martin, LLC conducts a free online seminar about meeting ARC-PA standards. In that seminar, I include more detail and information on responding to the commission’s requests, and am available for questions, too.
Finally, as previously stated, your SSR analysis of competencies will be discussed in my next blog. Be sure to join me for this informative entry.
