ARC-PA 5th Edition Standards: Presenting Data for Appendix 14B

Welcome back! Today, we continue unpacking ARC-PA’s 5th Edition Standards, Appendix 14 with a review of how to respond to the requirements in Appendix 14B.
What does Appendix 14B require?
Appendix 14B requires that your PA Program submit data and analysis regarding how your enrolled students assess the sufficiency and effectiveness of administrative aspects of the program and the available institutional resources. Thus, anything defined in Appendix 14B needs to become part of your data collection process.
For example, program administrative aspects include policies and procedures, and admissions processes and outcomes. In defining your program’s institutional resources, you should include whatever such resources support your program such as:
- Financial resources
- Human resources
- Physical resources
- Technology resources and support
- Safety and security
- Student services, which the glossary defines as academic advising, tutoring, career services, financial aid, student health, computing, and library resources and access
- Support for faculty development, clinical site development, curriculum design and course selection, program assessment, and program diversity and inclusion.
Graphics/Tabular Displays
Include three years of data. If your program has been in operation for less than three years, simply include as much data as possible.
I recommend presenting data in a way that allows for appreciation of trends over time.
You may also reference data/analysis in other parts of the SSR.
Let’s look at a couple different ways to present your results.
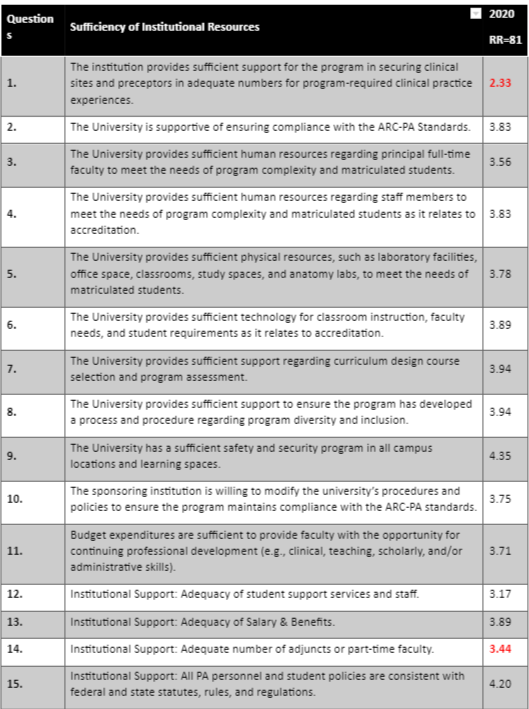
This is a five-point Likert Scale showing the average scores given by students in response to a series of review questions, with a response rate of 81%. It shows that there are some areas falling below the program’s benchmark of 3.5. You could extend the display to demonstrate three years and then highlight at which points benchmark was unmet. Highlight any areas that are below the program’s benchmark. Look for trends, then identify areas that need to be addressed.
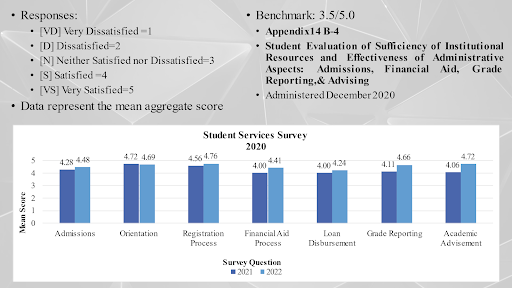
You can display data in different ways. The following is a Student Services Survey, which shows ratings over two years. Be certain that you define terms, years, and what the Likert score means.
I hope this has provided clarity on presenting your student body’s responses in annual review. We’ll continue examining Appendix 14C and how to best present your collected data on the effectiveness of your didactic curriculum in our next blog.
