ARC-PA 5th Edition Standards: Appendix 14F and Presenting Correlations to PANCE Performance

Thanks for “clicking in” to my blog once again! As you know, we are deep into a review of the various requirements of Appendix 14 of ARC-PA’s 5th Edition Standards. Today we begin looking at Appendix 14F requirements, and some ideas on how the data may be presented.
In Appendix 14F, the Commission requests your presentation of PANCE outcomes in your PA program. This means looking at how admissions, course grades, test grades and other points of data correlate with PANCE scores, and which of these are predictors of success or failure on the test.
Data analysis related to PANCE outcomes is to include, but is not limited to, correlation of PANCE outcomes and:
- Admissions criteria as a predictor of success
- Course outcomes
- Course and instructor evaluations by students
- Program instructional objectives, learning outcomes, and breadth and depth of the curriculum
- Student summative evaluation results
- Remediation practices and results
- Student progress criteria and attrition data
- Feedback from students who were unsuccessful on PANCE, if available
- Preceptor and graduate feedback (employer feedback is not required but may be helpful if available to the program)
Course Outcome Correlations
One thing we can look at is how well each course correlates with PANCE. We illustrate an answer to the question, “How well do these courses discriminate?” Some courses should not discriminate; you must choose which classes are even appropriate. However, some core courses, for example, Clinical Medicine, are ones that you would expect to be predictors. Thus, you want to test, and make certain that they are.
In one case, we did an actual regression of many first-year variables. At the very end of this is, there were two courses that ended up being predictors: Surgery and Clinical Medicine. So that gave us the sense of how much variance these two classes accounted for. If you have classes that you believe should be predictors, but you run regression and the variance is very small, then you must examine the class itself. Is the taxonomy of testing appropriate? If your top students are not performing in a commensurate way, then you may have an issue.
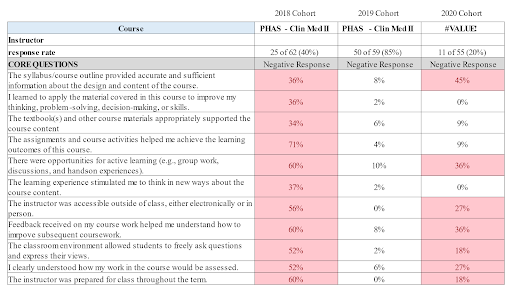
You can also look at student evaluations of courses themselves. Over the last three years, or at least during a year when you had a lower PANCE outcome, were there any classes that had more negative responses? Did you have any classes that had lower overall ratings? That might give you insight about whether there were issues with a course at the course level or on the instructor level, which may have caused some impact downstream on the student’s success.
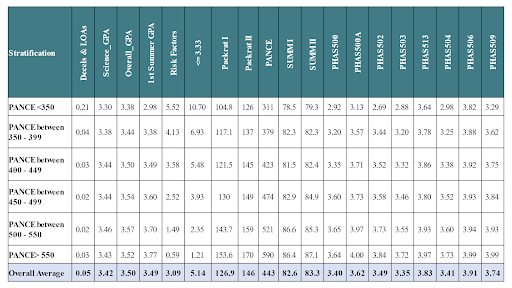
Another way you can look at this is the stratification table. The stratification table takes the student’s performance on the PANCE, then looks at critical variables of those who did not pass, asking, “What was the overall average in those variables when students have scored in that strata?” Then, do the same thing when it goes all the way up to the top strata. What you should see is a consistent stepwise increase in those areas. Now, this is not statistical; it is descriptive. But, in some of these courses, if you are seeing no separation between students who are failing PANCE and those that are getting high scores, then there may be some issues with the overall grading.
Another option is a heat map, which for example, examines up to four years of data or more, and gives a quick view of where trends are developing. Over time, you can look at pass rate and you can look at the departure from the overall national average to see if areas are increasing or decreasing. In this case, you can see that some concerns have been in Ear, Nose and Throat. There are also some concerns in Dermatologic Studies. Some of these might reflect the fact that, in this case, there was a lower overall pass rate, which caused globally decreased scores. If you have a three- or four-year trend of below national average, it is valuable to observe what is happening within that system.

For more information, I recommend reading my book, Learning to Love Data. You will find that Chapter Four has a solid explanation on how to do these various comparisons. You’ve regressed previous data – PACKRAT I and II, Summative exams, and thus you can generate predictive scores. Each time each data point is generated, the student gets another predictive score. As you add elements, your predictive score becomes more accurate.
In my next blog, I will continue to cover Appendix 14F by looking at how to correlate a) C-grades and below, b) preceptor ratings, and c) student remediation with PANCE scores. I hope you will join me!
