Advanced Assessment Methods: Performance Variables and PANCE Scores

In the past few blogs, we have examined various statistical concepts, so that we can derive interpretations from them. Previously, I discussed statistical significance, used as a pre-designated point at which we can say that the appearance of a correlation is probably not due to random chance.
The point of looking at correlation coefficients and statistical significance, for the PA program, is eventually to determine what courses, exams or other indicators correlate with passing PANCE scores. We use correlation and statistical significance to find, primarily, which variables can be used to predict PANCE performance.
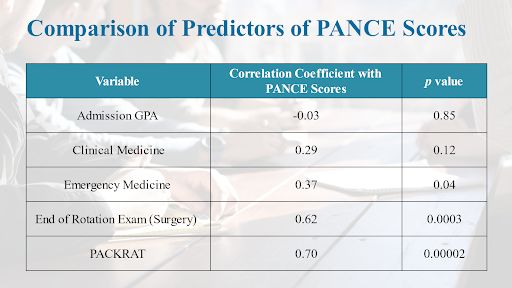
This chart shows how R values and p values change as we correlate certain variables to PANCE scores.
- We can see that “Admissions GPA” did not correlate with PANCE scores – that -.03 is almost a “zero” correlation coefficient, plus an extremely high p value shows high randomness in the numbers.
- There is a minor increase with clinical Medicine, but .29 is still only a medium-level correlation coefficient. There is a 12% chance (p value) that these results could be random – which seems low, but doesn’t reach our required value of .05 statistical significance.
- We see a jump at Emergency Medicine. The correlation coefficient rises to a medium-to-high level at .37, and the p value moves to .04 percent, meaning that there is less than a five percent chance that these results are random. Now we have a decent correlation as well as significance, meaning that Emergency Medicine scores do give us some ability to predict PANCE scores.
- The most valuable measurements come in the last two examples- the EORE for Surgery shows a .62 correlation coefficient – quite high – and the p value has shrunk smaller than even the .01 level required for more stringent scientific testing.
- Finally, the PACKRAT exam is the most significant predictor of all, with the highest correlation coefficient and the lowest p value. A student’s score on the PACKRAT will be a seriously good predictor of their PANCE score with random chance so unlikely that it is barely a consideration.

The chart above shows an example of the relationships of the PANCE and several different exams. Pay attention to the asterisks, which indicate that the p level is significant at the .01 or .05 level.
As you can see, these are large, significant relationships between the major tests given to PA students and their subsequent PANCE performance.

The chart above is a representation of over four hundred data points I put together. You can see the PACKRAT I exam is here with the PANCE – the relationship tends to be moderate. This is the R-squared (or R2, also referred to as “the variance”), and it is the percentage by which our correlation coefficient score predicts the PANCE score. The R2 in this case (noted in upper right corner of graph) is 0.4586.
Now, this is an important distinction. In the Pearson Correlation Coefficient chart, we note that the PACKRAT has a high correlation coefficient with the PANCE – and now I have a chart showing a .4586 R2 or variance. What is the difference – why is one number higher than the other?
The R2 represents the proportion of variance in the outcome explained by the predictor variable. In other words, the PACKRAT score’s .688 correlation has almost a 46% chance of predicting the PANCE score. It is how we account for variability between subjects – after all, as you can see by my chart, most of the data points do not fall exactly on the line of positive correlation. Some are quite close, and others fall rather higher or lower. In simple terms, about 54% of student’s scores are influenced by something (or things) other than their PACKRAT score.
Initially, this may feel like a difficult jump to make, from a correlation to a variance prediction. We’ll explore this further in my next blog. I’ll begin our discussion of regression, which will provide a great deal of clarity to this matter. In the regression model, we learn how to take multiple variables (because no single variable will ever be the “entire” explanation of a PANCE score) and determine which ones effect the outcome, and by how much. I hope you will join me then.
